Детальная аналитика кликов
Secure links with powerful analytics — track every click, every visitor, every conversion in real time.
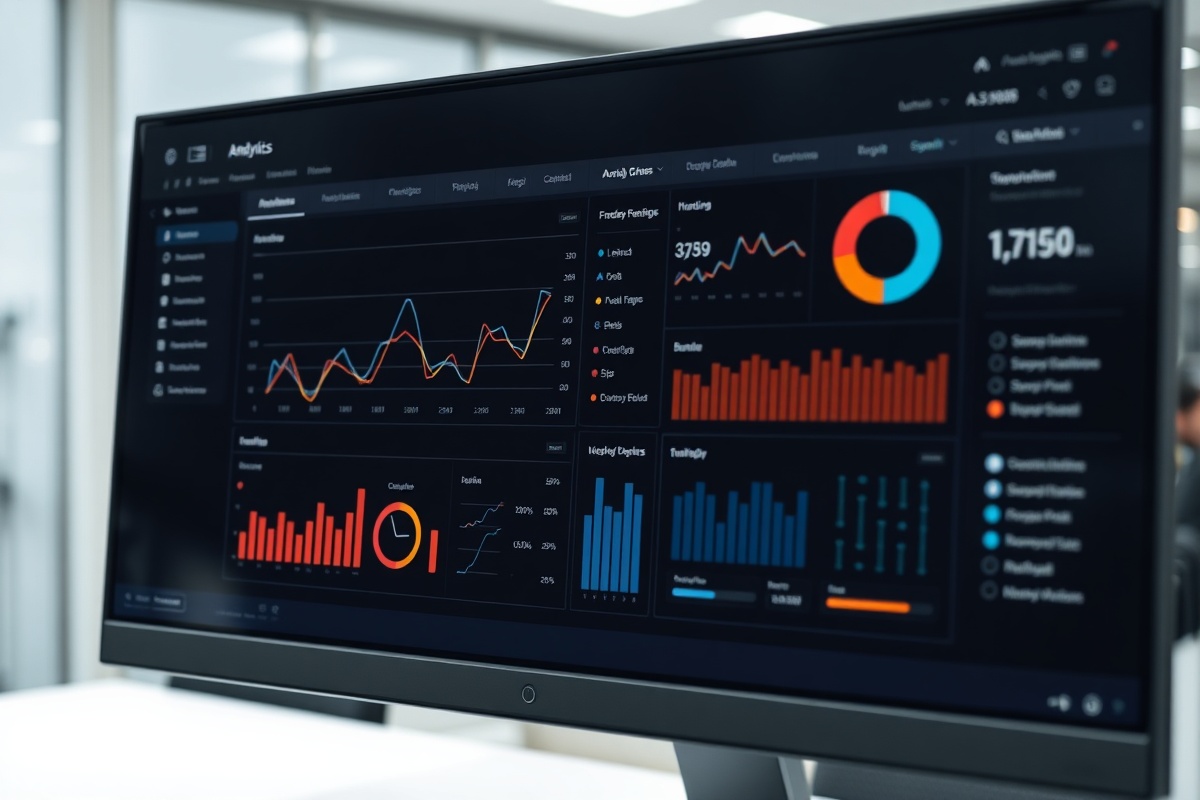
Dashboard Overview
See everything at a glance
Linkify's analytics dashboard consolidates every dimension of your link performance into a single, scrollable workspace. Within seconds you can identify which campaigns are driving traffic, which audiences are converting, and where to reallocate budget.
The dashboard updates in real time — no manual refresh needed. Clicks from your latest Twitter thread, scheduled email blast, or QR code at a conference appear on the graph the moment they happen. Each shortened link maintains its own mini-dashboard, so you can drill down from campaign-level aggregates to individual URL performance without losing context.
Export any view as CSV or PNG for stakeholder reports. Scheduled weekly summaries arrive in your inbox automatically, complete with trend arrows and anomaly flags so you never miss a spike or a drop.
Metrics That Matter
Granular data, actionable insights
Every click is enriched with context. Linkify captures and categorises more than a dozen data points per visit so you can segment, compare, and optimise with precision.
Geolocation
Country, region, and city-level breakdowns for every link. Spot that your Berlin audience clicks 3× more than Madrid and adjust ad spend accordingly. Data sourced from MaxMind GeoIP2 with daily updates.
Devices & Browsers
iOS vs Android, desktop vs tablet, Safari vs Chrome — full device fingerprinting on every click. Know whether your landing page needs a mobile optimisation pass or if desktop users are the ones actually converting.
Traffic Sources
Uttm parameters are parsed automatically. See exactly whether clicks arrive from Twitter, LinkedIn, email newsletters, referral partners, or direct QR scans. Tag custom sources with UTM-friendly labels built into the shortener.
Click Timing
Hourly and daily heatmaps reveal when your audience is most active. Schedule posts for the Tuesday 14:00 UTC peak instead of guessing. Timezone-aware charts let you analyse performance in your audience's local time, not server time.
Real-Time Graphs
Live-updating line charts, bar graphs, and funnel visualisations refresh every 30 seconds. Watch a viral tweet drive a 400 % click spike in real time, or monitor the decay curve of an email campaign hour by hour.
Conversion Tracking
Integrate with Google Analytics 4, Facebook Pixel, or server-side webhooks. Linkify fires custom events on click and on destination-page load, so you can attribute revenue directly to specific shortened URLs inside your CRM.